Conceptual Analysis should start with a workshop and conclude with a review of the work products of a the stage. The work products communicate the knowledge of the problem and its solution that is established during this stage. Visualization can provide insight into both problem and solution and will often provide guidance into the desired look and feel of a solution. For the customer visualization is a mode of communication; this is an essential task and incorporates all other aspects of analysis. The customer may bring existing material to a workshop and this is the classic place where a whiteboard can be used to great effect.
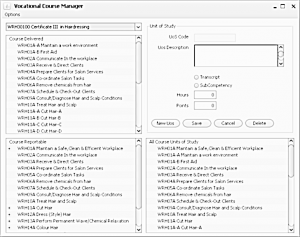
Visualizations may include color schemes, screen mock ups, sample reports, examples on spreadsheets and simple drawings. This is a good time to talk about ‘non-functional’ requirements such as how the user will interact with the system. As part of visualization document any screen layouts using a simple table and paste any screen mock ups into the example.
Example visualization:
|
The New Solution |
||
| Menu |
|
|
| Advertising Space | ||
| Disclaimer | Contact | |
Visuals can be a a great enabler of discussion and can lead the stakeholders and the analyst into the areas of the process model and information model. Visualization is also an area where it can be useful for the programmer who will be developing the user interface to attend the workshop to work with the stakeholders and the analyst on usability features.
